


The reformed Payment Times Reporting Scheme has produced reports across four reporting periods, covering July 2024 through June 2026. Headline numbers suggest two uneventful years. The median payment time across the register has sat at 23 to 24 days in every period, and the average at 25 to 26. Read at that level, the scheme looks like it is measuring a market that has stopped moving.
It is not. The flat headline is the product of several thousand entities moving in different directions. To see it, you have to analyse the register as a set of entity histories.1 We tracked 2,973 entities, 87 percent of all reporters, each against its own history.2
Beneath the flat headline
From the first year to the second, 1,256 entities shortened their median payment times, 905 lengthened them, and 812 held within a day. Nearly as much movement ran in one direction as the other.
The movement is not steady in either direction. Of the 2,123 entities that reported in all four periods, only 77 shortened in every period, and only 62 lengthened in every period. Another 169 held steady the whole way. The remaining 1,815 followed no consistent path, mixing shortening, lengthening and holding across the two years. For more than 85 percent of the register, payment times are drifting, not trending.
Industry is not the driver
An obvious explanation for movement in different directions would be sectoral. Industries face different cash cycles, different seasonality, and different supplier bases. If payment conduct were set at the industry level, the movement should cluster.
It does not. Across the fifteen industry divisions with at least 50 entities in the analysis, the share that shortened sits between 36 and 48 percent in all but one, against 42 percent for the register as a whole. The median change within every division rounds to zero. Construction looks like Manufacturing, which looks like Mining, which looks like Financial Services. The one division outside the band, Arts and Recreation Services, leaned toward lengthening, and it holds just 50 entities.
Whatever is driving payment times, it is not at the industry level, it is at the entity level.
Where an entity starts matters
The cut that does separate the register is starting position. When entities are banded by their first-year payment times and compared to their second year, the pattern is consistent across the average, the median, the 80th percentile and the 95th percentile.
Entities that started slow moved toward the middle. Among the 264 entities whose 95th percentile payment times began above 90 days, 73 percent shortened, with a median movement of 16 days.
At the fast end, the drift runs the other way. Among entities whose 95th percentile payment times began at or below 30 days, 37 percent lengthened and 23 percent shortened. Entities whose median began at 20 days or less show the same tilt. The movement is small at any individual entity, but it is systematic.
Put together, the register is not getting faster. It is compressing toward the middle, and the middle sits near the 30-day mark that standard payment terms anchor. Entities at the long end are closing the gap. Entities comfortably inside the norm are relaxing toward it.
Terms are moving faster than payments
The 30-day anchor is observable. The register's median common payment term is exactly 30 days in every one of the four periods, and most entities have never changed their terms.
Where terms did move, changes for actual payment lagged behind. 563 entities shortened their common terms between their first and second year, by a median of 10.5 days. Their actual payment times shortened by a median of 2 days. Stated policy moved five times further than observed practice. Forward signalling shows the same shape: across more than 6,000 entity-period observations, entities forecast a shorter term for the next period only 190 times, and delivered the forecast term in 44 percent of those cases.
Does any of this reach suppliers?
The measure that answers that is the share of invoices paid within terms. It is the number hardest for small business suppliers to plan for: when payment comes later than expected.
On that measure the register has moved: the median on-time rate rose from 70.9 to 73.0 percent between the two years, with 1,300 entities up by two percentage points or more and 933 down. And it tracks payment-time movement closely. Entities whose median times lengthened by five days or more saw on-time rates fall 6 percentage points. Entities that shortened by the same amount gained 6.8 percentage points.
The entities that cut their terms are the caution. Tightening the promise without re-engineering payment operations produced faster terms on paper and no added reliability for suppliers.
What does this mean for reporting?
Payment times reporting has done something simple and new: it shows how each business actually approaches paying its suppliers.
Two years of data show that interpreting payment times by sector and market conditions is too coarse. Sector may set the parameters, but change is entity driven.
Whether you are a small business wanting to manage cash flow, or any other reader of the register, start at the entity level.
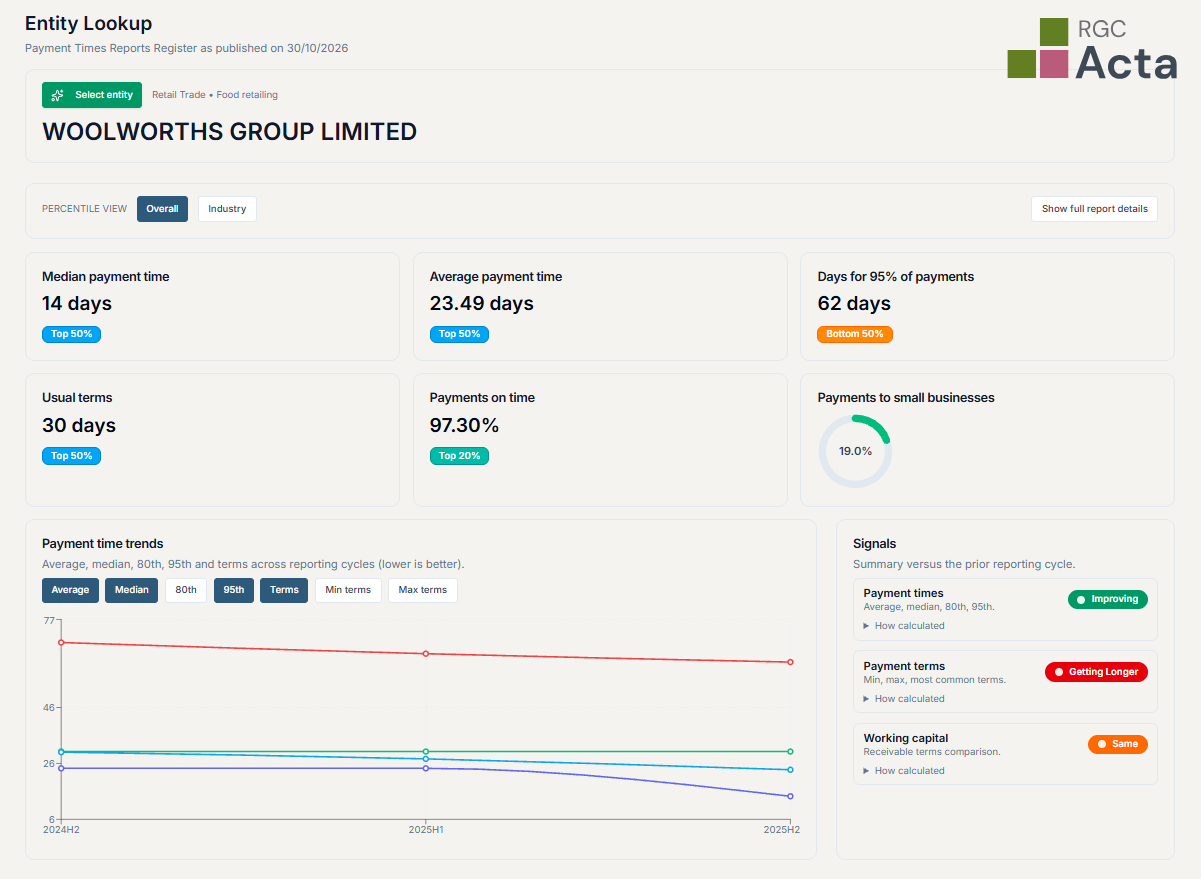
Entity-level data is only useful if it is accessible, so we built it into PTR inFOCUS. It holds every published report across all four periods, tracks each entity against its own history on every measure in this article, and shows where an entity stands against its industry and the register in a few clicks.
Notes
- All figures are drawn from the public register as published on 30 October 2026, using each entity's latest lodged report for each period. The most recent period was still receiving lodgements at that date.
- Across the four periods, 3,428 entities lodged at least one standard report, and 2,123 appear in all four. Most of the gap is mechanical: 589 entities have reported in the first three periods but not yet the fourth, another 498 entered the scheme after the first period, and roughly 165 reported early and have since left the register, consistent with threshold changes, restructures and consolidation into group reports. Year comparisons average each entity's available reports within 2024-25 and within 2025-26, and require at least one report in each year. That covers 2,973 entities, 87 percent of all standard reporters, and damps the distortion of any single unusual period. Where an analysis needs an unbroken four-period run, the 2,123 entities present in all four periods are used, and identified as such.